
Annie Johansson
PhD Candidate
Optimizing Personalized Learning at Scale
Department of Psychology
University of Amsterdam
A Problem That Shouldn't Be Skipped: Problem Skipping Limits the Accuracy of Ability Estimates in Online Learning
Preprint (PDF) · GitHub repository · Poster (IOPS 2024)
Abstract
The estimation of student ability is paramount in large-scale personalized learning. To this end, state-of-the-art adaptive learning environments use item response theory (IRT). Previous work in traditional learning assessment has demonstrated that unidimensional IRT models fall short in adequately estimating ability when items on a test are skipped. In this study, we extend this work to online learning platforms. We analyze data from a large-scale online learning platform used to practice Arithmetic. Using the IRTree framework, we compare the unidimensional model of accuracy to a multidimensional model which additionally accounts for the decision to respond or skip a problem. We found support for problem-skipping as a non-ignorable process: students that were more likely to problem-skip were more likely to make erroneous responses. Further exploration revealed individual differences in the strategies involved with problem-skipping. To ensure that learning analytic tools are supported by fair measurement models, we suggest several ways to account for problem-skipping when estimating student ability.

Figure 1. Correlation between estimated nodes in the fully estimated IRTree model. The left graph displays the correlation between the item skipping threshold ($\beta^{(1)}$), and the item difficulty ($\beta^{(2)}$). The right-hand graph displays the correlation between the individual propensity to skip an item ($\theta^{(1)}$), and the individual propensity to answer incorrectly ($\theta^{(2)}$). For both graphs, The scatter plot denotes individual data points, and the regression line displays the best-fitting linear relationship between the nodes. Density plots denote the distribution of each random parameter.

Figure 2. This graph displays eight individual users extracted based on their estimated propensity to skip and make an incorrect response (center graph). Users are displayed in a clockwise fashion starting from the upper right corner (low accuracy, high skipping), to the upper left corner (low accuracy, low skipping) of the scatter plot. Each graph plots each each individual's response sequence to items in the Series game. The position on the y axis reflects the response time to the item. Colors denote the response type (correct, incorrect, question mark). While some users had longer response sequences in the extracted data (users C and E), the x axis is limited to showing the first 300 responses, to ease the visualization.
Key Findings
- Problem-skipping and accuracy are distinguishable latent traits. The fully estimated IRTree model — which allows skip propensity and accuracy to be measured as separate dimensions — outperformed the unidimensional baseline on both in-sample fit (AIC/BIC) and out-of-sample prediction (k-fold cross-validation RMSE). This confirms that treating skipped responses as simply a proxy for low ability is incorrect, and that non-responding carries information beyond what a standard IRT model captures.
- Skip propensity and accuracy are moderately, not perfectly, correlated. At the student level, the correlation between propensity to skip (Node 1) and propensity to answer incorrectly (Node 2) was r = 0.41 — positive, but far from the perfect correlation assumed by unidimensional models. At the item level, the correlation between item skipping threshold and item difficulty was higher (r = 0.77), meaning difficulty is a stronger driver of skipping at the item level than at the individual level. The gap between these two correlations is itself meaningful: students' skip tendencies are shaped by individual differences in metacognitive regulation and motivation that go well beyond item difficulty.
- Individual differences in skipping strategies. Examining individual response sequences revealed students who skipped frequently yet responded correctly at high rates. Their sequences often showed long runs of rapid skips followed by bursts of correct answers — a pattern more consistent with strategic effort avoidance than with low proficiency. This directly challenges the unidimensional model's core assumption and suggests that some students use the skip option as a self-regulation strategy rather than as a signal of not knowing the answer.
Data & Methods
We analyze data from the Series game in Prowise Learn (formerly Math Garden), a computer-adaptive arithmetic practice platform. The dataset contains responses from 3,795 students across 386 items, in which students can choose to skip a problem by pressing a dedicated skip button. We fit a two-node IRTree model using Stan, and compare it to a standard unidimensional 1PL IRT model using posterior predictive checks and model fit indices. Code and materials are available on the GitHub repository.
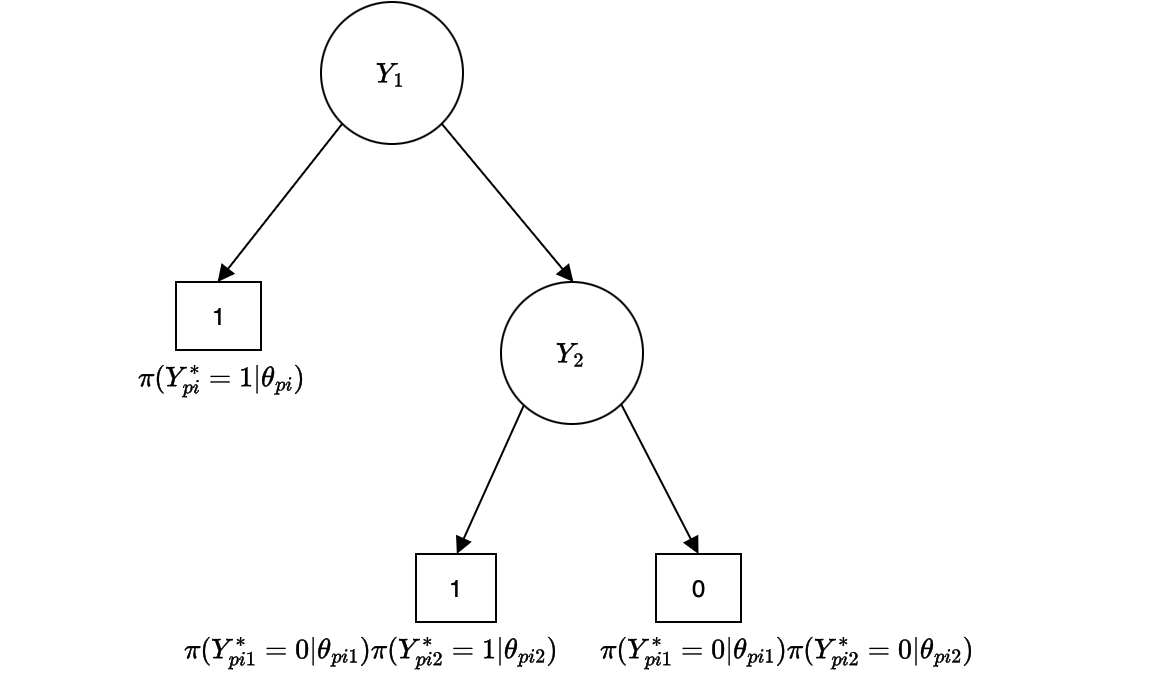
Figure 2. The IRTree model used in this study. Node Y1 captures the student's decision to skip a problem (outcome: 1 = skip) or attempt it (continue to Y2). Node Y2 captures the accuracy of the response (1 = correct, 0 = incorrect). Each node has its own latent trait, allowing problem-skipping and accuracy to be modeled as distinct processes.